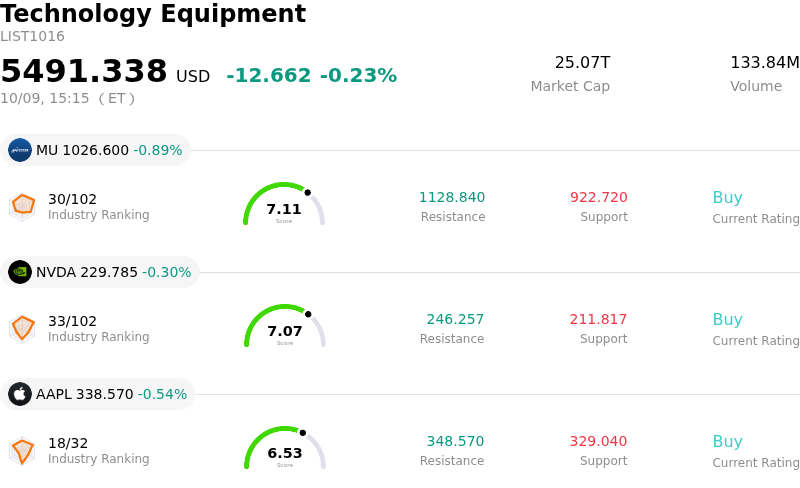
HP Inc (HPQ) moved down by 7.08%. The Technology Equipment sector is down by 0.23%. The company underperformed the industry. Top 3 stocks by turnover in the sector: Micron Technology Inc (MU) down 0.89%; NVIDIA Corp (NVDA) down 0.30%; Apple Inc (AAPL) down 0.54%.
What is driving HP Inc (HPQ)’s stock price down today?
The sharp downward pressure on HP Inc. shares stems primarily from dismal preliminary third-quarter global personal computer shipment reports published by industry research firms IDC and Omdia. The data highlighted a steep double-digit year-over-year contraction in worldwide PC shipments, breaking typical seasonal growth patterns. Among major PC manufacturers, HP suffered the most severe volume decline, significantly underperforming broader industry metrics. This drop was driven by an aggressive first-half inventory buildup that pulled demand forward, leaving secondary-half channels oversupplied as end-user demand softened.
Underlying the demand slowdown are rising component costs, particularly for memory chips and storage, which have forced hardware prices higher and suppressed consumer purchasing appetite. These elevated supply chain expenses have compressed operating margins across HP's Personal Systems division. The cost pressures reinforce market anxiety following management's cautious outlook regarding full-year profit targets and the expectation of lingering industry volume contraction. Furthermore, HP's cash-generating Print division continues to face persistent structural headwinds, compounding worries that price increases can no longer offset unit volume erosion.
Compounding the negative industry dynamics, institutional sentiment has turned increasingly cautious, leading to analyst downgrades. Concerns center on the fading benefits of temporary tailwinds—such as corporate PC refresh cycles—and the risk of further margin compression. Additionally, recent open-market stock sales by senior corporate executives have heightened investor nervousness. With company-specific volume declines outpacing broader market trends, investors are recalibrating valuation multiples to reflect lower growth assumptions and lingering profitability risks.
Technical Analysis of HP Inc (HPQ)
Technically, HP Inc (HPQ) shows a MACD (12,26,9) value of -0.483, indicating a neutral signal. The RSI at 42.973 suggests neutral condition and the Williams %R at 99.064 suggests oversold condition. Please monitor closely.
Fundamental Analysis of HP Inc (HPQ)
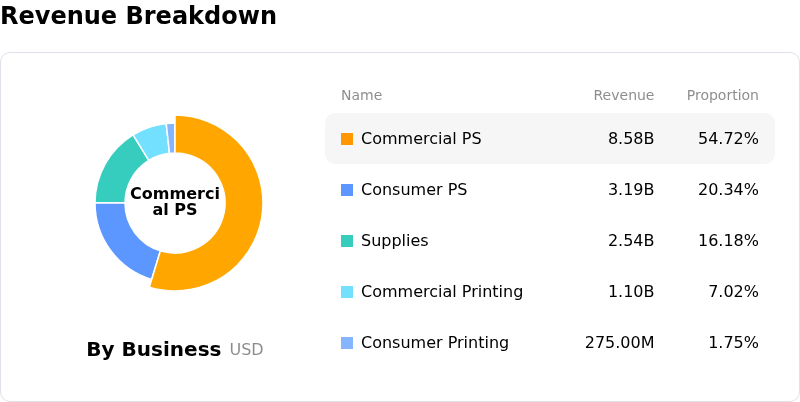
HP Inc (HPQ) is in the Technology Equipment industry. Its latest annual revenue is $55.30B, ranking 5 in the industry. The net profit is $2.53B, ranking 6 in the industry. Company Profile
Over the past month, multiple analysts have rated the company as Hold, with an average price target of $26.69, a high of $33.80, and a low of $19.00.
More details about HP Inc (HPQ)
Company Specific Risks:
- Sharp Contraction in Global PC Shipments: Recent preliminary market data showed a 20.1% year-over-year drop in global PC shipments, with HP suffering the sharpest decline among major vendors at nearly 31% year-over-year, driving sharp intraday selling pressure.
- Margin Compression from Component Inflation: Surging memory chip component costs have compressed Personal Systems operating margins down to 4.6%, as aggressive end-user price increases fail to fully offset input costs while simultaneously dampening consumer demand.
- Structural Headwinds in Print Segment: HP's traditionally cash-generative Printing segment continues to experience secular decline and margin erosion, driven by stagnant office demand and intensifying price competition in commercial hardware.
- Withheld Forward Guidance and Insider Sales: Management's decision to withhold fiscal 2027 financial guidance due to PC market weakness, coupled with recent Form 144 filings detailing executive insider stock sales, has deepened institutional caution surrounding the company's growth trajectory.
Find out more